Sargassum is one of the few marine problems you can watch from space. The Great Atlantic Sargassum Belt, a recurring bloom that has formed every year since 2011, can stretch from West Africa to the Gulf of Mexico.1 Seeing it is the easy part. Knowing which beach it will reach, and when, takes several layers of forecasting working together.
Layer 1: seeing the belt from orbit
Floating sargassum reflects light differently from open water, especially in the near-infrared. Satellite instruments such as MODIS and VIIRS, and since 2024 the Ocean Color Instrument on NASA’s PACE mission, measure that difference. Researchers turn it into an index of floating algae density that can be mapped across the Atlantic.12
Those maps showed a record year in 2025. In June 2026, the belt was the second largest on record, while the Caribbean Sea and the Gulf hit record highs. NASA estimated about 9 million metric tons of sargassum in the eastern Caribbean and 3.6 million in the western Caribbean that month.1
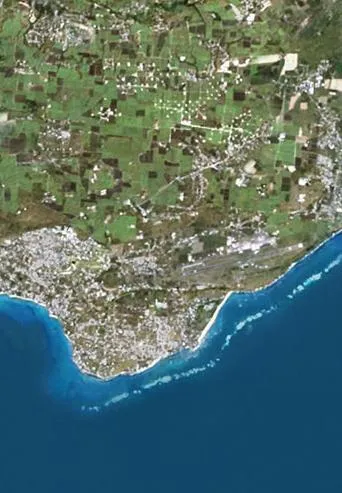
Sargassum in the eastern Caribbean in June 2026, a record month, according to NASA Earth Observatory.1
Layer 2: the monthly outlook
The University of South Florida’s Optical Oceanography Lab runs the Sargassum Watch System, which publishes daily and weekly satellite maps and a monthly Sargassum Outlook bulletin.23 The bulletins describe how much sargassum is in each region, whether it is growing, and what to expect in the coming months. For a hotel or a tourism board, this is the season-planning view: is this a heavy year, and when will it peak?
Layer 3: weekly landfall risk
Basin-scale maps don’t say which beach will be hit. NOAA’s Atlantic Oceanographic and Meteorological Laboratory narrows the picture with an experimental Sargassum Inundation Risk product. It analyzes satellite density in the 50 to 100 km of water off each stretch of coast and assigns a weekly risk level: low, warning, medium or high.4
NOAA is clear about the limit. Winds, waves and currents ultimately decide how much floating algae washes ashore, and research has shown that adding shoreward wind data greatly improves agreement with what actually lands.4
Layer 4: the last few kilometers
The final step is the hardest: tracking individual mats over days, close to shore, where clouds, waves and coastline shape the outcome. This is where satellite products meet drift models that use surface currents and wind, and where eyes on the water matter most.
How HavBotics plans to use each layer
BeachDefender is being designed around this stack. In the planned approach, monthly outlooks would set the season plan and the number of vessel pairs a coastline needs. Weekly risk maps and drift forecasts would tell crews where to position pairs offshore. Onboard 360° cameras and live onshore monitoring would handle the final approach, so mats could be intercepted at sea and redirected before they reach the beach.
Validating that concept of operations, showing that blooms can be seen and predicted accurately enough to intercept them, is one of the three goals of HavBotics’ pre-seed round.